Dashboards are a way to envisage the most crucial information at a glance. Every application comes with a pre-defined dashboard. While the pre-defined dashboard may suffice, the actual usefulness of dashboards lies in the ability to create and customize it. TCPWave offers two dashboards; one is "Pre-defined Dashboard," and the other is "Custom Dashboard." This whitepaper provides insights into the Custom Dashboard.
TCPWave's Custom Dashboard
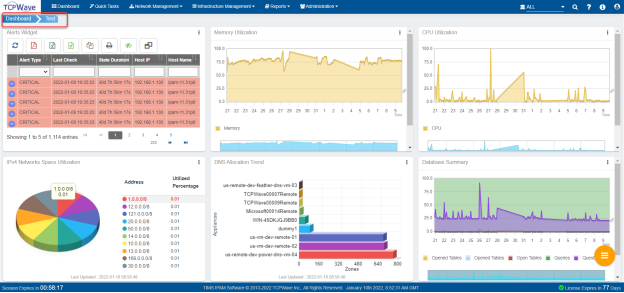
The capability to visualize data is highly significant in today's technology-driven business landscape. Therefore, the TCPWave's Custom Dashboard enables you to analyze a set of comprehensive data from across the entire application in a single pane of glass on the home screen. It offers wide-ranging capabilities of visualizing different statistics, alerts, graphical summaries of reports organized in various customized widgets. The displayed statistics include network, subnet, object, zone, resource record details, and other measurable information. All the quantifiable information is displayed in various formats such as graphs, pie, histograms, etc. You can manage the displayed data, which improves the usability experience tailored to your enterprise requirements.
Advantages of Custom Dashboard
Each network administrator has the privilege to create multiple dashboards for various purposes.
Custom Dashboards remain editable, whereas the system restricts you from editing the pre-defined dashboard.
Irrespective of the roles, the system allows the network administrator to create a customized dashboard to view the application statistics with zero blind spots. It helps to interpret and act upon data quickly.
You can build your custom widgets based on the widget category to meet your needs.
Once you've created your widgets, you can drag to resize or rearrange them in this visual interface.
How To Customise Dashboard Using TCPWave IPAM GUI
The content above and sections on creating and editing Custom Dashboard is available in a complete document, which you can access by using the download button below.
We use cookies on this site to
improve your browsing experience, analyze individualized usage, and
website traffic tailor content to your preferences, and make your
interactions with our website more meaningful. By clicking "Accept All" closing this banner, or continuing to browse this site, you
consent to the use of cookies.